I've spent much of my time lately teaching a course about how birds become data and writing a book about the politics, practice and poetry of counting birds. I've made a podcast about checklists, built bunch of little bird-y web things and created a pile of avian-inspired visualizations.
In between these things I've been out a lot with binoculars around my neck, looking at the black-capped night herons that roost in my park, admiring the bright little warblers that pass through in the fall and searching for cryptic woodcocks in and amongst the autumn leaves.
It's fair to say I'm a little obsessed. Obsessed in particular with how it isn't just birds that are represented in bird data, but a kind of conversation - between a bird, a person, and a place. Here's one record from eBird in Brooklyn last year, selected more or less at random:
URN:CornellLabOfOrnithology:EBIRD:OBS2109375559 2024-04-30 19:41:18.256704 33889 species avibase-42101632 Scarlet Tanager Piranga olivacea 2 United States US New York US-NY Kings US-NY-047 30 Green-Wood Cemetery, Brooklyn L285884 H 40.6523083 -73.9904281 2024-04-30 12:58:00 obsr874153 S171199783 Traveling P22 EBIRD 231 6.703 1 1 0 1 0
The entire point of eBird data is to support studies at the population level. This record is meant to be subsumed into a larger data set, to be averaged, to be a signal for a predictive model. But if we take a moment to actually read it, It's not hard to imagine this birder in Green-Wood Cemetery on a Tuesday afternoon in march, with her binoculars trained into the trees. To imagine her catching a flash of red up in the crown of an oak tree, to feel her pulse quicken as she found the tanager in its impossibly vibrant sprint plumage.
Between October 1st, 2023 and September 30th, 2024 birders in Brooklyn made 385,962 observations of 4,120,714 birds from 302 species. Every single one of those records is visualized in the graphic below:

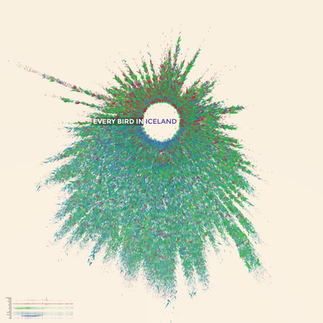
The result is something exuberant, almost explosive. The graphic reads like a clock, where 12:00am is October 1st and 11:59pm is September 31st. There are (count 'em) 52 spikes for weekends, when birders are most likely to be out looking at birds. Brooklyn is right in the middle of the Atlantic Flyway. In two ebullient stretches in the spring and autumn the city is bustling with birds... and the visualization bursts past its bounds. Zoom in and you'll see every individual observation, color-coded by taxonomy. The triangles are sized to the number of birds seen and shaped to the particular beak shape of the species. In the section below you can find big groups of green ducks and thin-billed blue cormorants; violet woodpeckers and all kinds of red passerine (perching) birds like sparrows and robins.


I've made (so far) a set of twelve works in what I'm calling the Every Bird series. They're wildly diverse in shape, color and character - a reflection of their individual geographies and of their particular communities of birders. There's Iceland with it's dripping beard of waterfowl, Sao Paolo aburst with its famous diversity, Indonesia beckoning us all to come and count its nearly 1,500 species. You can see the Christmas Bird Count at 11:30pm in Miami, San Francisco and Brooklyn, and what must have been bumper safari days in Kenya. Look closely and you'll find many more patterns, and many more stories.
The detail in these projects defies the limited number of pixels we have on our screens. I made them by very deliberately ignoring data visualization's tendency for simplicity and reduction; they're meant for close reading, not for fast consumption. Which is why I made prints! Each of the Every Bird variants is available as an archival quality print in four different sizes, and as a poster in two. Each of the print sizes apart from the very biggest one (40"x40") is available in a museum quality, non-glare frame. Visit the Every Bird page in my shop to see all available variants.


15% of the proceeds for every print and poster sold will go to Wild Bird Fund, NYC's only wildlife rehabilitation and education center. The folks at WBF care for thousands of birds every year, and I'm happy to give them whatever help I can. If you're interested in a print from another region, you can fill out this form and I'll see what I can do. These prints take some time to produce, so please only make a request if you think you'll be able to order a print.
Data Citation:
Auer T, Barker S, Barry J, Charnoky M, Curtis J, Davies I, Davis C, Downie I, Fink D, Fredericks T, Ganger J, Gerbracht J, Hanks C, Hochachka W, Iliff M, Imani J, Jordan A, Levatich T, Ligocki S, Long M T, Morris W, Morrow S, Oldham L, Padilla Obregon F, Robinson O, Rodewald A, Ruiz-Gutierrez V, Schloss M, Smith A, Smith J, Stillman A, Strimas-Mackey M, Sullivan B, Weber D, Wolf H, Wood C (2024). EOD – eBird Observation Dataset. Cornell Lab of Ornithology. Occurrence dataset https://doi.org/10.15468/aomfnb accessed via GBIF.org on 2024-10-31.


Comments